| |||||||||||||||||||||||||||||||||||||||||
| |||||||||||||||||||||||||||||||||||||||||
| |||||||||||||||||||||||||||||||||||||||||
|
| |||||||||||||||||||||||||||||||||||||||||
| |||||||||||||||||||||||||||||||||||||||||
| |||||||||||||||||||||||||||||||||||||||||
|
May 2021 was yet another remarkable month for home sales activity in LSTAR's jurisdiction: the Association recorded 1,258 residential transactions via its MLS® systems - up 87.5% from May 2020, when the local real estate market was experiencing a pandemic-induced decline.
"This number marks the second best May for LSTAR home
sales, surpassed only by May 2017, when LSTAR REALTORS® sold 1,433 homes,"
said LSTAR 2021 President Jack Lane. "However, year-to-date sales are at
an all-time high. At the end of May, there have been 5,175 sales, up 64.3% over
the same period last year."
The overall inventory figure, which shows how long it would take
to liquidate the existing housing supply in our area at the current rate of
sales activity, remained at 0.6 months - its lowest level in the last decade.
"Combined with the high demand, the lack of housing supply
is pushing the Sales to New Listings ratio up, creating a Sellers' Market with
multiple offers for many listings and numerous properties sold over the asking
price," Lane added. "Nonetheless, it's essential for consumers to
understand that each home is unique and its sale price can vary based on its
location, type, and features," he emphasized.
The single-family home remains on top of the local buyers'
preferences, with 937 sales in May.
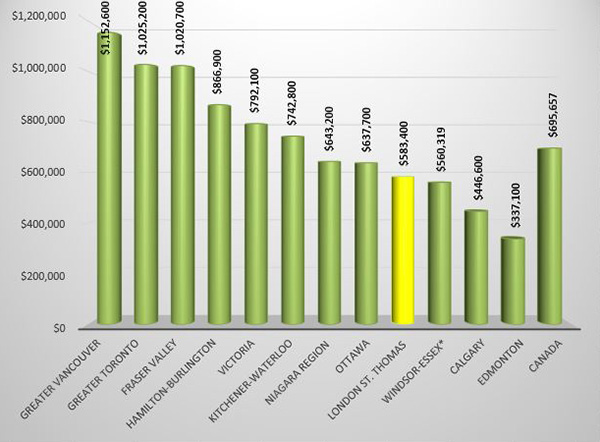
Despite all the increases seen in the HPI benchmark prices and
average sales prices, homes in LSTAR's jurisdiction appear to be relatively
affordable when compared to houses from some other major Ontario and Canadian
centres. The following chart is based on data taken from the CREA
National Price Map for April 2021.
| ||||||||||||||||||||||||||||||||||||||||||||||||
| ||||||||||||||||||||||||||||||||||||||||||||||||
|
The London and St. Thomas Association of REALTORS® (LSTAR) announced 1,296 homes exchanged hands in March, an increase of more than 56% compared to the same time a year ago. The total sales are the highest recorded for the month of March since the Association began tracking data in 1978.
"We've experienced a very robust start to the first quarter of 2021, with the seventh consecutive month of record sales," said LSTAR 2021 President Jack Lane.
Low supply and high demand continue to affect the average sales price across the major areas of LSTAR's jurisdiction.
At the end of March, there were 0.4 months of inventory, lower than the 0.6 months of inventory reported at the end of February. Out of the five main areas, St. Thomas and Strathroy had the lowest housing supply, with only 0.3 months of inventory. Elgin had the highest supply with 0.7 months."
Single-family homes were the most popular housing type sold in March, with 941 sales. The table below shows the March benchmark prices for all housing types and how they stack up against the values from a year ago.
| MLS® Home Price Index Benchmark Prices | ||
|---|---|---|
| Benchmark Type | March 2021 | Change over March 2020 |
| LSTAR Composite | $566,000 | ↑ 36.2% |
| LSTAR Single-Family | $625,300 | ↑ 41.3% |
| LSTAR One Storey | $555,100 | ↑ 35.0% |
| LSTAR Two Storey | $698,300 | ↑ 46.2% |
| LSTAR Townhouse | $419,300 | ↑ 26.9% |
| LSTAR Apartment | $286,500 | ↑ 3.2% |
"The record March home sales could translate into more than $94 million back into the local economy within the next few years," Lane said. "The business of real estate is a huge contributor to getting the economy back on track, as all sectors continue to manage the impacts of the COVID-19 pandemic."


